Course management
Playing the Percentages, part 2: how to measure your own shot pattern

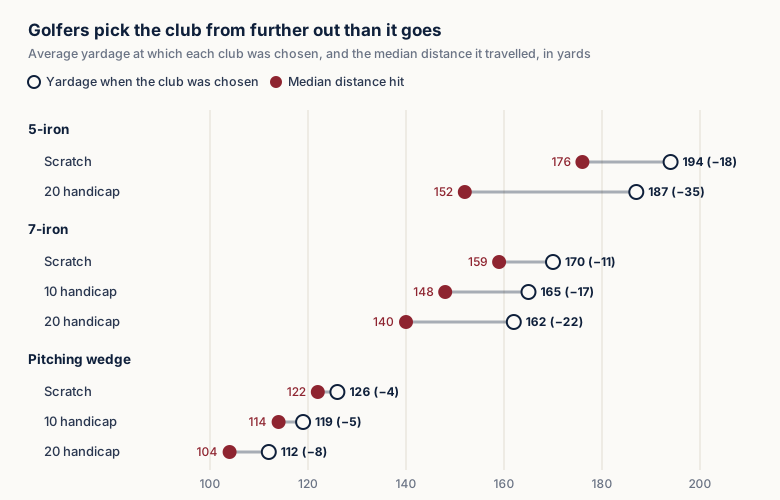
Golfers off 20 reach for the 7-iron at 162 yards on average, yet their median 7-iron travels 140. Part 2 of Playing the Percentages, a seven-part series on course management, shows how to measure your real distances and shot pattern, and tell a pattern from bad luck.
Jeff Beglane, a 12-handicap insurance adjuster from Westford, Massachusetts, told the Wall Street Journal in 2017 that from 150 yards he usually pulls his 9-iron, because that is how far it goes when he flushes it. Then he leaves it 20 yards short. “In reality, how many times have I hit that shot, and how many times have I attempted it?” he said.
Arccos, whose sensors record every shot its users hit, put numbers on the habit in 2020. It compared the average yardage at which golfers hit each club with the median distance that club travelled. A scratch golfer hits the 7-iron from 170 yards on average, and the median 7-iron goes 159. Off 20 the gap doubles: the club is chosen at 162 yards and travels 140. A 20-handicapper’s 5-iron is 35 yards short of the yardage it is hit from, while the pitching wedge is between 4 and 8 yards short at every level.
 Graphic: The Head Pro. Source: Arccos, 24 April 2020
David Dunning, a psychology professor at the University of Michigan, told the same newspaper that when we rate ourselves we picture “the golfer we’re going to be after we take enough lessons”. Part 1 showed that the right target depends on the size of your shot pattern, and a pattern pictured from memory is too small.
Three numbers for every club
For each club you need the median distance, the width of the pattern and its depth. The median is the middle shot when you line up all your shots by distance; with 20 balls it is the average of the 10th and 11th. One topped shot drags an average down but barely moves the median. The USGA used the same idea when it measured 627 golfers with TrackMan between 2021 and 2023. Each hit seven balls with a driver, a 7-iron and a pitching wedge, and the USGA called the median the golfer’s “ability” and the average of the two longest shots “capability”. The men’s median 7-iron averaged 149 yards.
Width is the distance from the ball that finished furthest left to the one that finished furthest right. Depth is the distance from the shortest carry to the longest. Later parts of the series that measure width another way say so and relate it to this one.
GOLFTEC analysed more than 10,000 swings in its database and removed the worst 30 per cent as mishits. Even then, the average 7-iron finished 36 feet long or short of the target for scratch players, 56 feet for 8-handicappers and 90 feet, or 30 yards, for 13-handicappers. Left and right, the 8-handicappers missed by only 3 feet less than the 13-handicappers.
An hour with a launch monitor
A launch monitor on a range or in a simulator bay gives all three numbers in one session. Take the USGA’s three clubs and hit 20 balls with each at the same target, without changing your aim between shots. Write down the carry of every ball and how far it finished left or right of the target line.
Tops, thins, shanks and heavy shots go in a separate column. Part 1 called them misses outside the pattern; no aim point allows for them.
Recording shots on the course
On the course, Arccos and Shot Scope log where each shot started and finished. Arccos plots every shot with a club as a dot on an overhead view. Shot Scope’s MyStrategy, launched in November 2023, draws a cone of dispersion for each club from the last 30 shots hit with it, shifted towards your usual miss.
A pencil does the same job more slowly. On every approach, write the yardage, the club and a letter in the margin of the card. G is on the green, S short, O over, L left and R right. A top, thin, shank or heavy shot gets an X, wherever it went.
Mike Adams, one of Golf Digest’s Legends of Golf Instruction, suggests going back over your last five rounds and counting how many shots went into a hazard and how many failed to move the ball to a better place. Only the mishits among them get an X; a well-struck ball that finds a bunker is part of the pattern.
A pattern, or a bad day
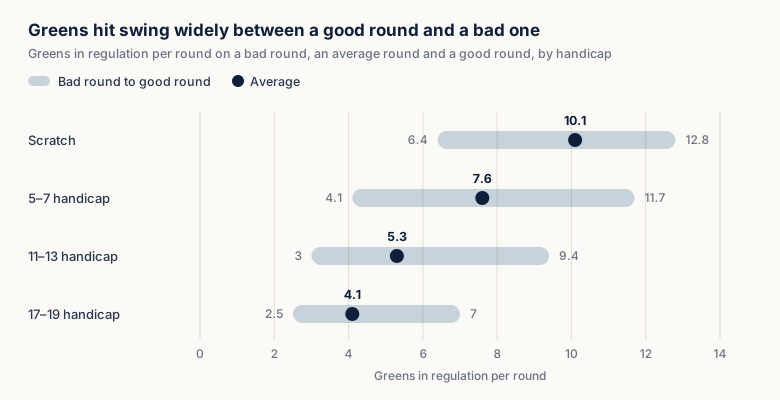
Lou Stagner of Arccos has measured how much greens in regulation vary between good and bad rounds for golfers of the same handicap. Scratch golfers average 10.1 greens, 12.8 on a good day and 6.4 on a bad one. Golfers off 17 to 19 average 4.1, 7 on a good day and 2.5 on a bad one.
 Graphic: The Head Pro. Source: Lou Stagner, Arccos data, via GOLF.com, 11 February 2022
One round tells you little. Five rounds still give only a handful of approaches with any one club, so read the short irons together and the long irons together, leave out the X shots and look at where the other misses went. Either they spread around the target or they bunch on one side. If a miss is equally likely to finish short or long, seven or more of ten landing on the same side happens by chance about one time in three (our calculation). Nine or more happens about one time in 47. Seven short and three over is a normal spread; nine short and one over points to a bias.
Misses that spread evenly are inside the pattern, and only the aim point needs work, which is part 4’s subject. A short bunch calls for more club, which our piece on taking one more club covers. If they gather left or right, move the aim point the other way, by about the distance from the centre of the bunch to the target.
Same handicap, different weaknesses
In 2023 Golf Digest and Arccos studied 1,000 golfers who all played off 7 to 9. Michael Hutchinson, a data scientist, sorted them by where they lost strokes against a scratch golfer and found six groups, each losing between 6.2 and 7.4 strokes a round. One group lost 3.6 strokes a round on the greens and less than a stroke in each other part of the game. Another putted almost as well as scratch and lost 6.3 strokes from tee to green. “Every golfer has their own unique fingerprint,” Stagner said in a 2023 Arccos piece.
Next: the tee shot
Part 3, on Sunday 25 October, goes to the tee. It covers what rough, trees and out of bounds cost, where to aim when out of bounds runs down one side, and why driver usually beats laying back, even with out of bounds on both sides.
Sources
- Arccos: Arccos Caddie helps overcome cognitive bias by providing Smart Distance data (24 April 2020)
- Arccos: The Wall Street Journal takes a deep dive into why golfers overestimate their ability (Brian Costa, 18 May 2017)
- USGA: Golfer Performance Measurement, 2023 update
- GOLF.com: This is the key to lowering your handicap, according to advanced stats (GOLFTEC, Keith Clearwater, 3 September 2022)
- Arccos support: What are approach game levers and dispersions?
- GolfMagic: Shot Scope launches MyStrategy (Johnny Percival, 8 November 2023)
- Australian Golf Digest: Trying to get better at golf this year? Start by doing this simple thing first (Alex Myers, 17 January 2026)
- GOLF.com: This important metric is the difference between good rounds and bad (Luke Kerr-Dineen, 11 February 2022)
- Golf Digest: We dived into the stats of 1,000 golfers hoping to break 80 (Luke Kerr-Dineen, 2 February 2023)
- Arccos: Understanding your Arccos stats with Lou Stagner (14 September 2023)
Spotted an error? Tell us and we will fix it. Our editorial standards.


